Thursday, October 1, 2026 | St. Lawrence County, NY

Americans have heard the caregiver shortage story for years. About 39.3 million people aged 15 and over provided unpaid care to someone 65 or older in 2024 and 2025, according to the Bureau of Labor Statistics time-use data, and the share of the population doing that work has drifted downward for more than a decade.
Here is the part of the story America has not heard: The math is worse next door. The Family Care Gap, a new cross-border analysis compiled by Life Assure from census, labor force and care-capacity data in both countries, finds that Canada has 2.86 adults of prime caregiving age (45 to 64) for every person 75 and older. The U.S. has 3.53. Six of Canada's ten provinces now sit below every single U.S. state on that measure, Hawaii included.
That inversion should get American attention, and not out of neighborly concern. Canada's institutional backstop, its long-term care bed rate, has slid in four years to a level below where the U.S. sits right now, on each system's own measure. The U.S. figure today is almost exactly where Canada was in 2021. The gap between what aging parents need and what working families can give is the same problem on both sides of the border, running on two clocks. Canada’s is running faster.
Adults aged 45 to 64 are the demographic engine of family caregiving; BLS time-use data shows caregiving rates peak in exactly that age band. As long as that group comfortably outnumbered the 75-and-over population, the family safety net held.
The new analysis, built identically from full population counts on both sides of the border, shows that the cushion is thinning at very different speeds. The U.S. holds 3.53 potential caregivers per senior. Canada holds 2.86. And the provincial breakdown is starker than the national one: Nova Scotia (2.58), New Brunswick (2.59), Quebec (2.62), Prince Edward Island (2.65), Newfoundland and Labrador (2.66) and British Columbia (2.67) all fall below Hawaii's 2.68, the thinnest ratio of any U.S. state.
Adults aged 45 to 64, per person aged 75 and older
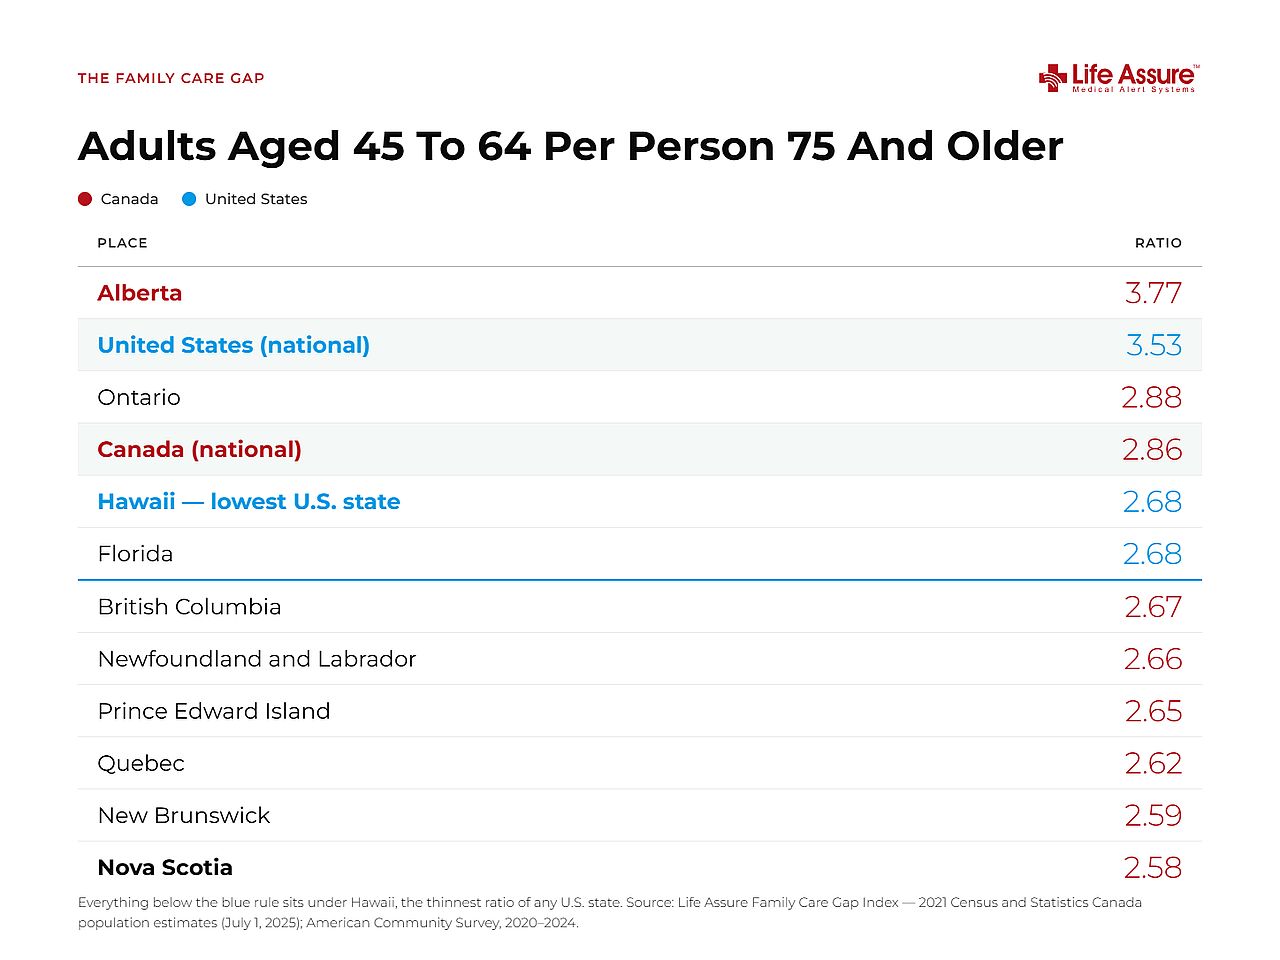
In terms of adults aged 45 to 64 per person 75 and older, Alberta, at 3.77, is the lone province that clears the U.S. average, and even Alberta would rank only in the middle of the American pack, roughly alongside California. For a country Americans may reflexively assume has senior care solved, the family side of the ledger tells a different story.
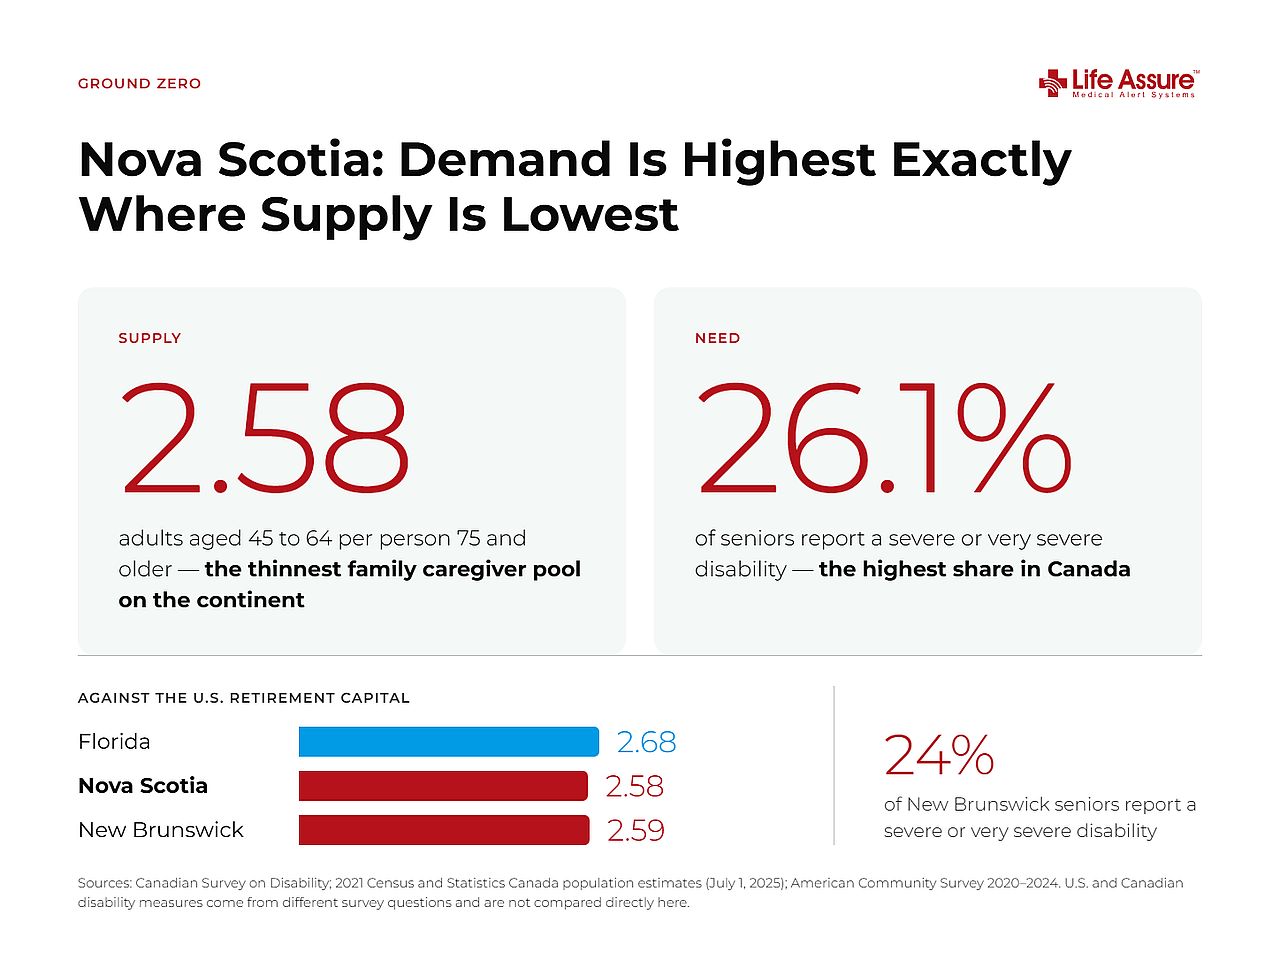
If the family care gap has a ground zero, it is Nova Scotia. The province combines the thinnest caregiver pool in either country, 2.58 adults per senior, with the highest share of seniors reporting a severe or very severe disability in Canada, at 26.1%.
Set that against the American state it most resembles demographically. Florida, the U.S. retirement capital, has a caregiver ratio of 2.68, and Nova Scotia sits below even that while posting the highest severe or very severe disability rate among seniors, based on Canada's own survey. Demand is highest exactly where supply is lowest.
The gap persists across Atlantic Canada. New Brunswick pairs the continent's second-thinnest caregiver pool with a severe or very severe disability rate of 24%. Hawaii and Florida's ratios reflect large retiree populations; Atlantic Canada's reflect an old population and a small middle-aged one.
A thin caregiver pool would matter less if the adults in it had time to spare.
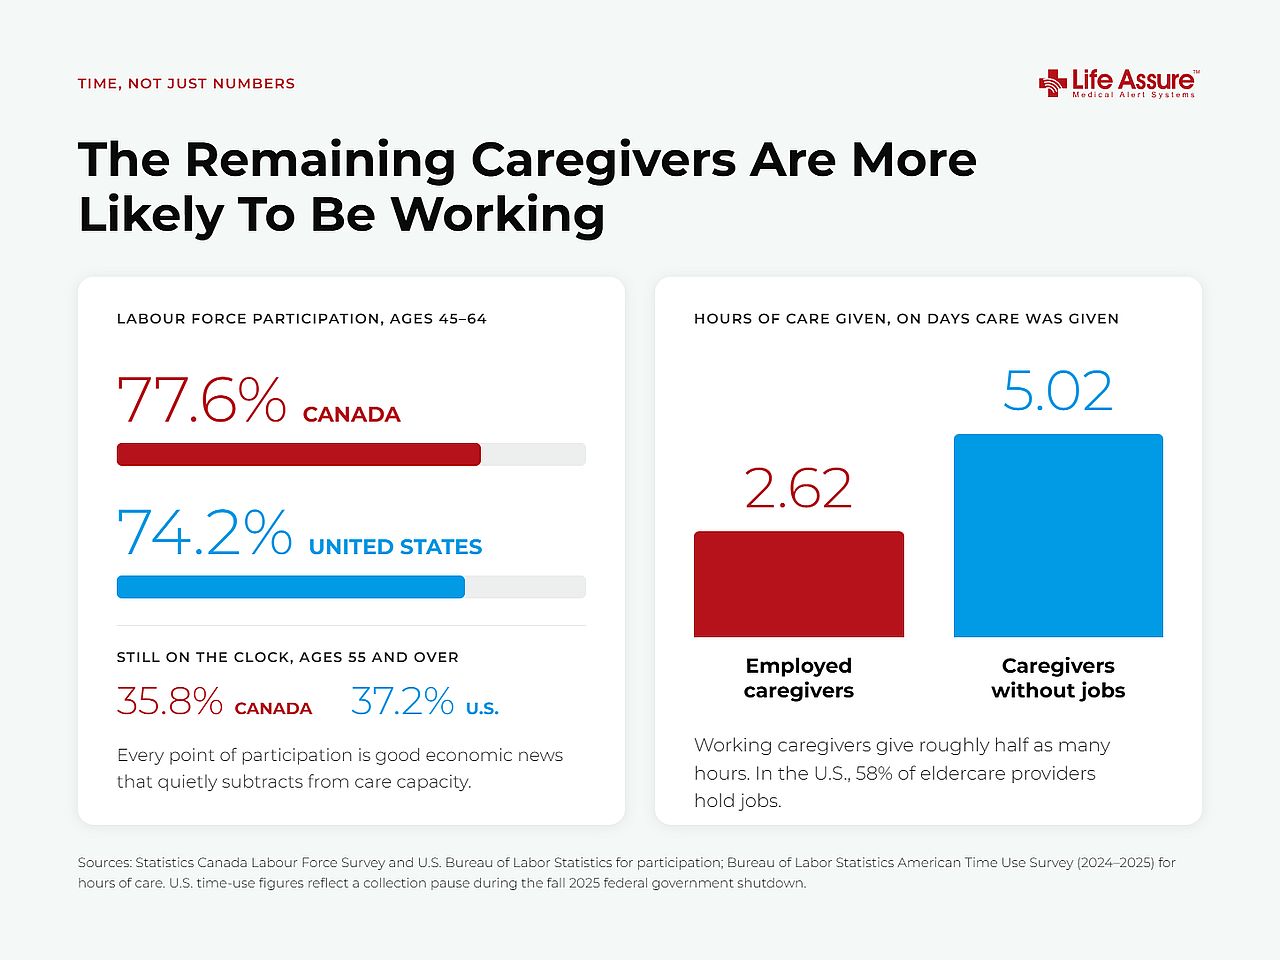
Among adults aged 45 to 64, 77.6% of Canadians are in the labor force, against 74.2% of Americans. Every point of participation is good economic news that unfortunately subtracts from care capacity. U.S. time-use data puts a number on the trade-off: employed caregivers surveyed provided an average of 2.62 hours of care on days they gave it, roughly half the 5.02 hours reported by caregivers without jobs. Canada has proportionally more of its caregiving generation in the workforce.
The squeeze extends past retirement age in both countries. Labor force participation among adults 55 and over stands at 37.2% in the U.S. and 35.8% in Canada, meaning a significant share of the people who might otherwise care for a spouse or an older parent are still on the clock themselves.
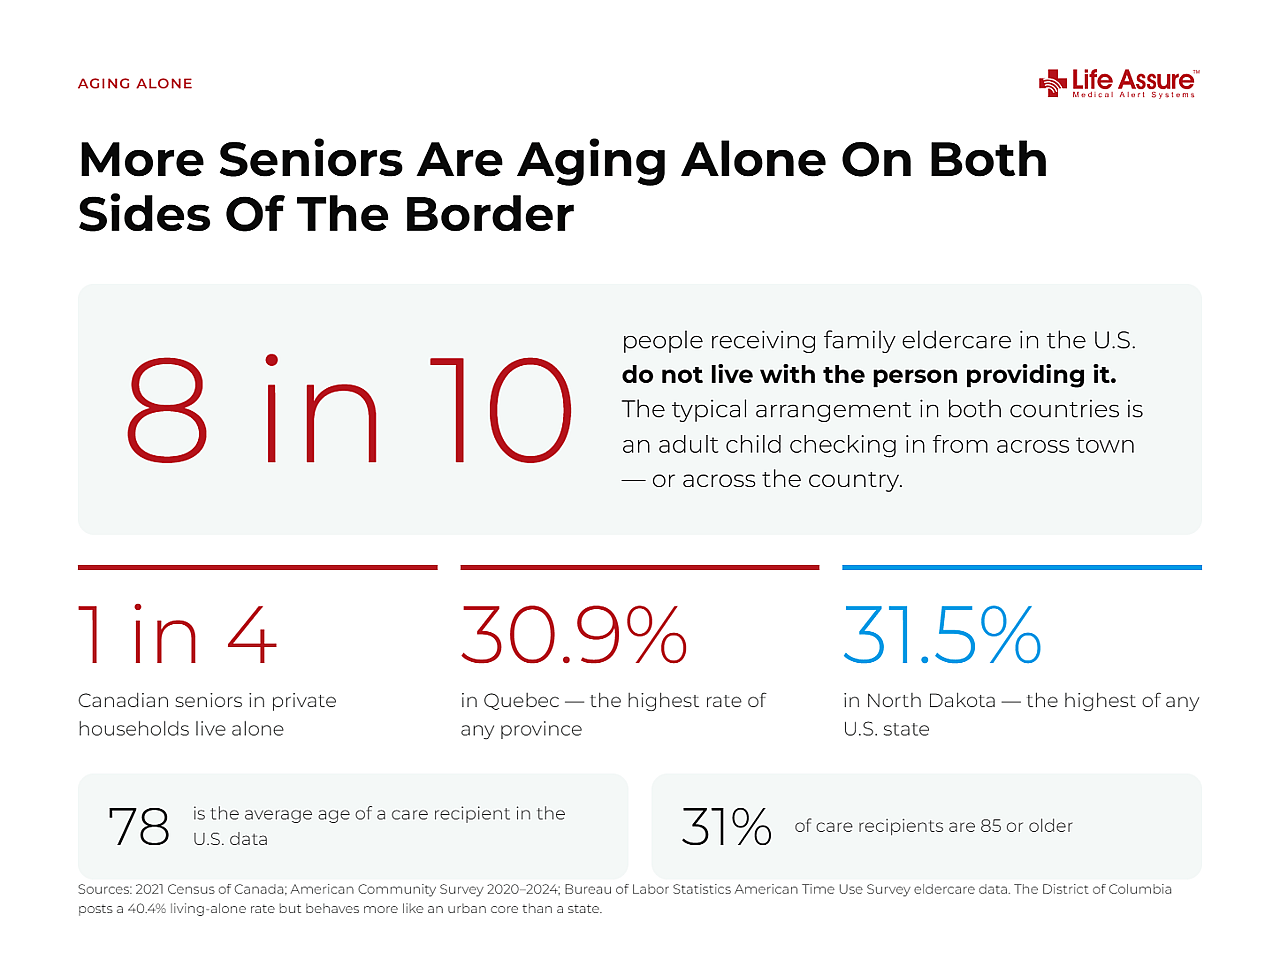
Living alone is where the demand side of the gap shows up most plainly: A senior with no one else in the home has no one on hand when a problem starts. In Canada, roughly one in four seniors in private households lives alone. Quebec leads the country at 30.9%, the highest rate of any province.
The U.S. picture is comparable. North Dakota tops the states at 31.5%, and more than half the states sit above 28%. The District of Columbia posts a 40.4% rate, though as a single city it behaves more like an urban core than a state.
What makes solo aging a family problem rather than a housing statistic is distance. U.S. caregiving data shows that more than eight in ten people receiving family eldercare do not live with the person providing it. The typical arrangement in both countries is an adult child checking in from across town or across the country, which is why families increasingly layer in supports that work when nobody is in the room, from neighbor check-ins to medical alert systems. The average care recipient in the U.S. data is 78 years old, and 31% are 85 or older.
When the caregiver pool shrinks, the pressure lands on the adults in the middle, and the Canadian survey data shows what that looks like up close.
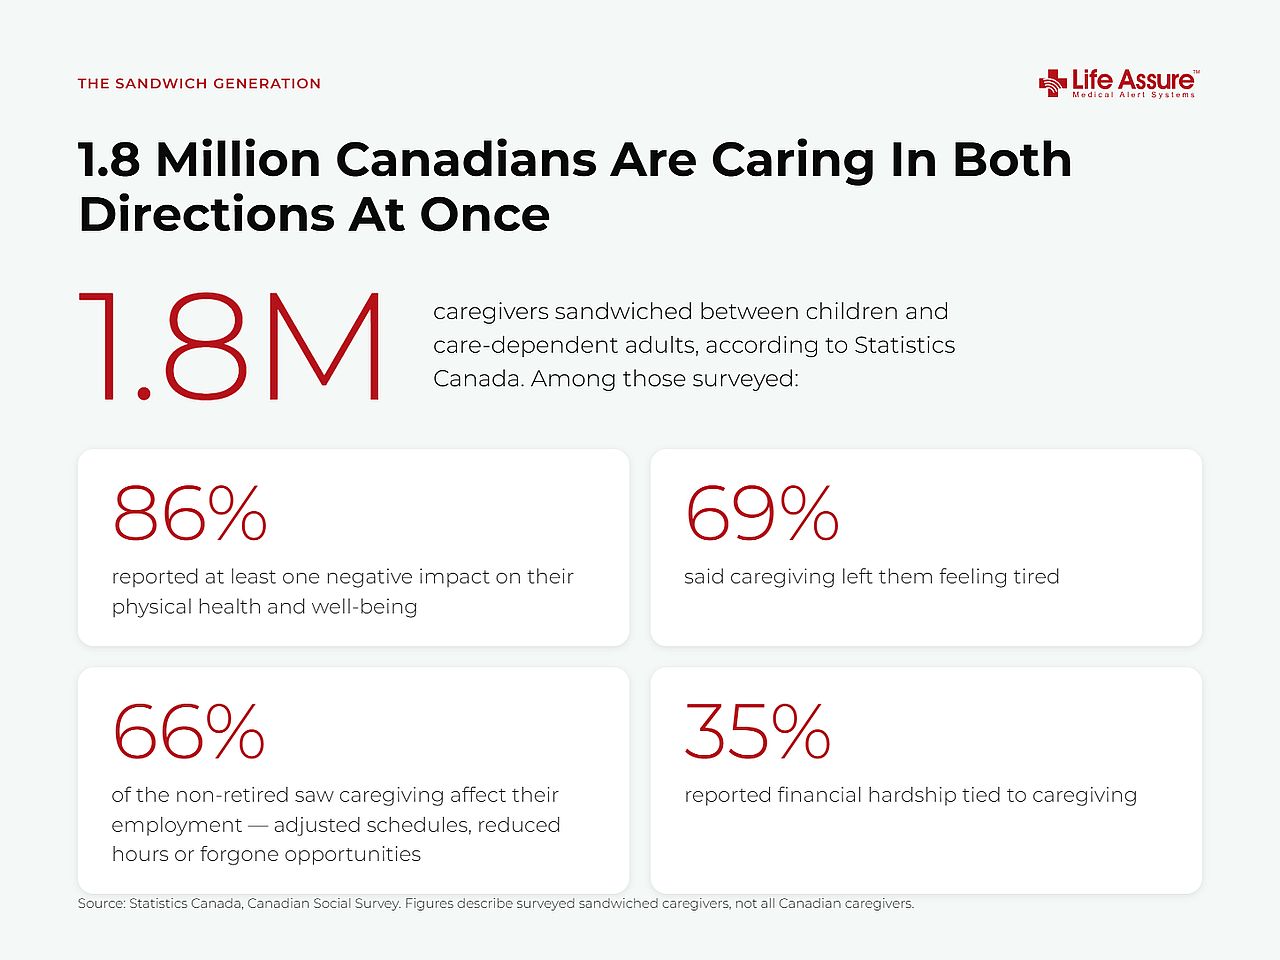
Statistics Canada counts 1.8 million caregivers sandwiched between children and care-dependent adults. Among those surveyed, 86% reported at least one negative impact on their physical health and well-being, 66% of the non-retired said caregiving affected their employment through adjusted schedules, reduced hours or forgone opportunities, and 35% reported financial hardship tied to caregiving.
The American data tells the employment half of the same story from a different angle. In the U.S., 58% of eldercare providers hold jobs, and the time-use diaries show those working caregivers compress their care into markedly fewer hours. Neither country's caregivers are opting out. They are triaging, and the survey responses suggest the cost of that triage shows up at work, in bank accounts and in exhaustion: 69% of Canadian caregivers surveyed said caregiving left them feeling tired.
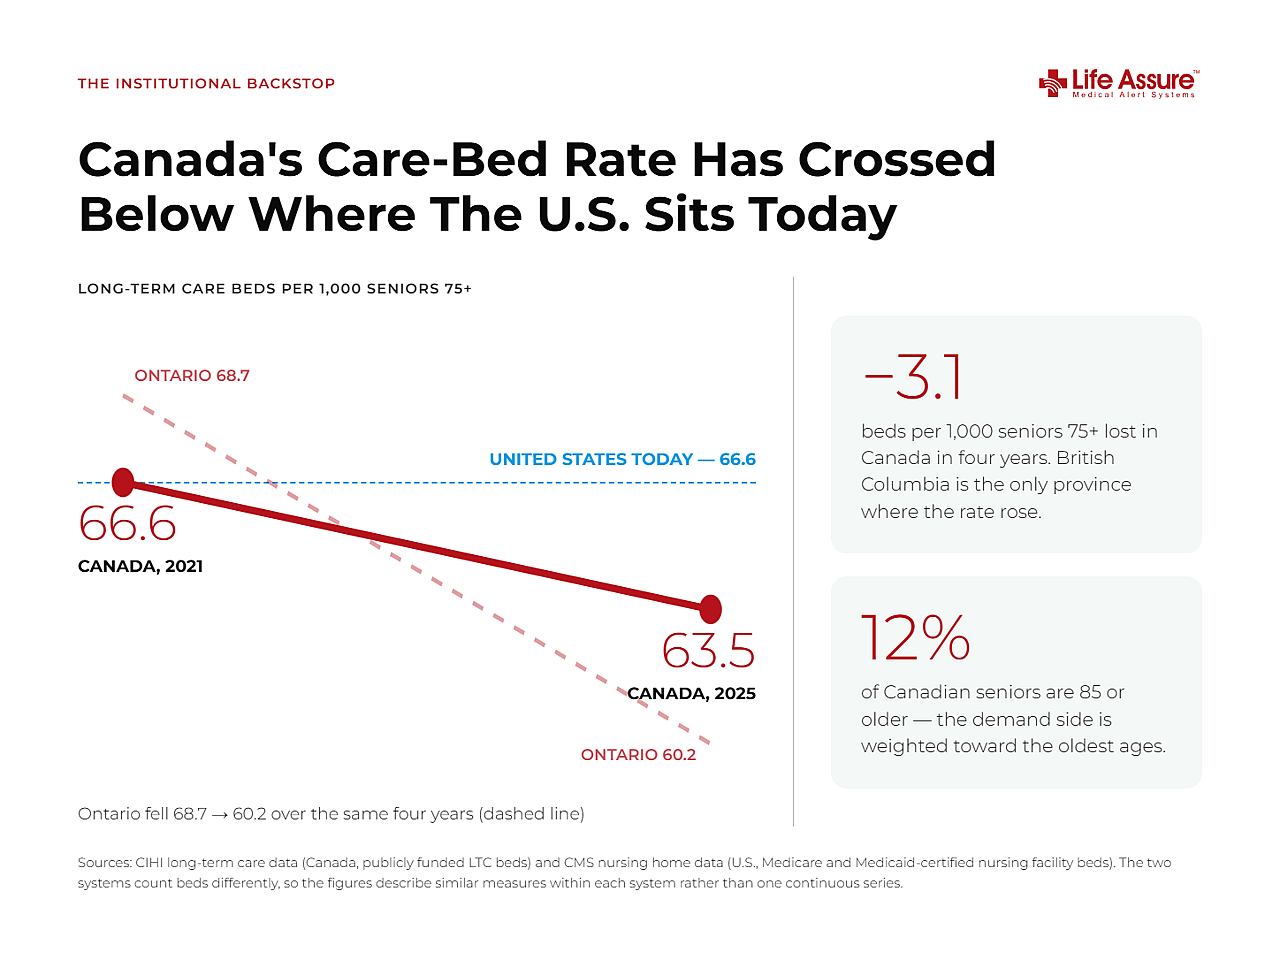
For families who cannot close the gap themselves, the backstop is institutional care, and here Canada's trend line has crossed below where the U.S. currently stands.
Canada's publicly funded long-term care beds have fallen from 66.6 per 1,000 seniors aged 75 and over in 2021 to 63.5 in 2025. The U.S. rate of certified nursing home beds sits at 66.6 per 1,000 today, the exact figure Canada posted four years ago. The two systems count beds differently: The U.S. tracks Medicare and Medicaid-certified nursing facility beds while Canada counts publicly funded long-term care beds, so the numbers describe similar measures within each system. The direction of travel is the point.
Ontario's rate fell from 68.7 to 60.2 in four years. British Columbia is the only province where the rate rose. Meanwhile, the demand side is weighted toward the oldest ages: Nearly 12% of Canadian seniors are 85 or older. If the U.S. wants a preview of what happens when bed capacity lags the 75-plus boom, Canada is running the experiment in real time.
The most useful thing about this data is that it dissolves a comfortable assumption. Americans may tend to file senior care under "things Canada does better," and on hospital coverage, that reputation may hold. On family care capacity, the raw demographic arithmetic, Canada now trails the U.S. as a whole, and six of its provinces trail every state, and the forces driving those numbers (longer working lives, solo aging and shrinking institutional capacity) are the same ones impacting American communities, just a few years behind.
The families on both sides of the border are not waiting for the demographics to reverse.They are rearranging work schedules, checking in by phone and building patchwork systems of support around parents who live alone. The data suggests the most important care infrastructure of the next decade may be whatever helps one stretched adult in Halifax or Houston look after a parent they cannot be with every day. It is one problem on two different timetables. The caregivers are still showing up. There are simply fewer of them, with less time to give.
To measure the gap between how much help older adults need and how much time family can realistically give, Life Assure built a five-part Family Care Gap Index for all 50 U.S. states, the District of Columbia and Canada's ten provinces (territories excluded). The index combines the share of seniors 65 and over living alone, the share needing help with daily living, the number of adults aged 45 to 64 per person 75 and older, labor force participation among those adults and long-term care beds per 1,000 seniors 75 and over. Adults aged 45 to 64 are used as the prime caregiving-age band because U.S. time-use data shows caregiving rates peak in that group. The ratio is demographic: It measures potential family caregivers, not a claim that all of these adults provide care. U.S. figures draw on the American Community Survey (2020 to 2024), the Bureau of Labor Statistics American Time Use Survey and CMS nursing home data; Canadian figures draw on the 2021 Census, Statistics Canada population estimates (July 1, 2025), the Canadian Survey on Disability, the Canadian Social Survey and CIHI long-term care data. The caregiver ratio is built identically from full population counts in both countries. U.S. time-use figures for 2024 and 2025 reflect a pause on collection during the fall 2025 federal government shutdown. U.S. and Canadian disability measures come from different survey questions and are not compared directly in this piece.
How does Canada's family caregiver supply compare to the United States?
Canada has a lower supply of potential family caregivers, with 2.86 adults of prime caregiving age (45 to 64) for every person aged 75 and older, compared to 3.53 in the U.S. Six out of ten Canadian provinces fall below every single U.S. state in caregiver supply.
Which Canadian province is experiencing the most severe care gap?
Nova Scotia has the lowest family caregiver pool on the continent, with a ratio of 2.58 adults aged 45 to 64 per senior aged 75 and older. This thin supply is paired with the highest share of seniors in Canada reporting a severe or very severe disability, at 26.1%.
How does employment impact the hours of care provided by family members?
Employment significantly reduces available caregiving time. According to U.S. surveys, employed caregivers provided an average of 2.62 hours of care on the days they provided it, which is roughly half the 5.02 hours given by caregivers without jobs. Canada has a higher percentage of its caregiving-age adults (45 to 64) in the labor force at 77.6%, compared to 74.2% in the U.S.
Are long-term care beds making up for the shortage of family caregivers in Canada?
No, institutional capacity in Canada is shrinking. The rate of publicly funded long-term care beds in Canada fell from 66.6 per 1,000 seniors aged 75 and over in 2021 to 63.5 in 2025. British Columbia is the only province where the bed rate rose over that four-year period.
This story was produced by Life Assure and reviewed and distributed by Stacker.